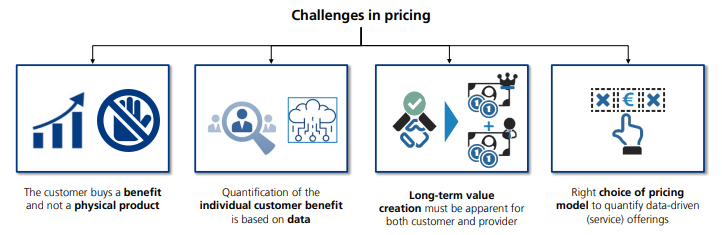
The growth in data availability enhances the potential for data-driven customer services, which emphasizes the need for companies to develop capabilities for effective monetization. Data-driven services can alter pricing models due to their scalability and lower reproduction costs, despite initial development expenses. A thorough understanding of the factors influencing pricing is crucial for successful monetization of these services.
| Topic Fields | |
| Published | 2022 |
| Involved Institutes | |
| Project Type | ICNAP Community Study |
| Result Type | |
| Responsibles |
The increasing availability of data augments the opportunity to offering data-driven activities for customers. This in turn raises the importance of having the required capabilities to competitively monetize those data-driven offerings. Against this background, emerging data-driven offerings may change how (service) offerings are charged and monetized. While the development efforts of data-driven offerings may hold costs, the reproducibility and scalability of those offerings are less expensive. To address and analyze how companies can effectively monetize data-driven offerings, a sound understanding to the influencing factors in the pricing process is needed.
Contact us to get in touch! With a membership, you’ll gain full access to all project information and updates.
© Fraunhofer 2026